In the fast-paced world of crypto trading in 2025, platforms like Ape.pro have become essential for traders chasing high-leverage opportunities in perpetual futures. With Solana's ecosystem booming and memecoin mania driving $50B+ in monthly volume, understanding the numbers on Ape.pro's interface can mean the difference between a profitable trade and a liquidated position. Ape.pro, Jupiter's advanced trading terminal for Solana-based assets, displays a wealth of data—from real-time prices to PnL calculations—but it can overwhelm new users with its dense metrics.
This guide is tailored for new and intermediate Ape.pro users, breaking down how to read numbers on the Ape.pro trading interface. We'll cover price displays, position size, leverage, PnL, liquidation risk, charts, fees, and more, with simple explanations, real-world examples, and screenshots-style guidance. Whether you're spotting a memecoin pump or managing a leveraged BTC perp, you'll gain confidence navigating the dashboard. (For spot swaps outside Ape.pro, consider Baltex.io as a zero-commission multi-chain option for seamless cross-chain trades.)
Optimized for featured snippets with tables, checklists, and bold examples, this guide includes pro tips to avoid common pitfalls. Let's demystify those digits.
Jump to prices | Positions & leverage | PnL breakdown | FAQ
Ape.pro's interface is a powerhouse for Solana traders, integrating Jupiter's liquidity aggregator with perp futures for memecoins and majors like BTC/ETH. But with 65,000 TPS on Solana and AI-driven bots sniping trades, misreading a number—like confusing entry price with mark price—can wipe out your stack in seconds. In Q3 2025, liquidation events spiked 40% during memecoin volatility, per Dune Analytics, often due to ignored risk metrics.
This guide simplifies it: No jargon, just actionable insights. We'll use examples like trading SOL/USDT perps, assuming a $1,000 starting balance. Always DYOR and start small—Ape.pro's demo mode lets you practice without risk.
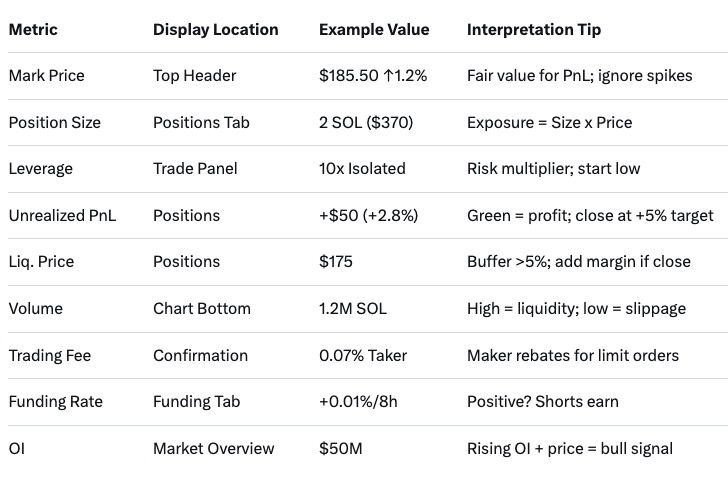
Ape.pro shows prices in multiple formats for clarity, pulling from oracles like Pyth for accuracy.
Example: Trading SOL/USDT long. Dashboard shows:
How to Read: Hover over prices for tooltip: "Mark Price: Oracle-derived, updates every 400ms." In charts, prices scale to $0.01 precision for majors, $0.0001 for memecoins.
Pro Tip: Enable "Price Alerts" in settings—ping when SOL hits $190.
Positions on Ape.pro are for perps, where size determines exposure.
Example: Deposit $500 USDT. Open long 2 SOL at $185 = $370 size. With 10x leverage, margin used: $37 (3.7% of deposit).
Tooltip Insight: "Higher leverage amplifies PnL but increases liquidation risk—use <20x for beginners."
2025 Update: Ape.pro added "Dynamic Leverage" for auto-adjust based on volatility, capping at 50x for memecoins.
Common Mistake: Oversizing—$1,000 at 100x on a $10 memecoin = $100k exposure. Stick to 1-2% risk per trade.
PnL (Profit and Loss) is Ape.pro's heartbeat, updating in real-time.
Formula: Unrealized PnL = (Mark - Entry) x Size x Multiplier Direction (long/short).
Example Table (Featured Snippet Optimized):
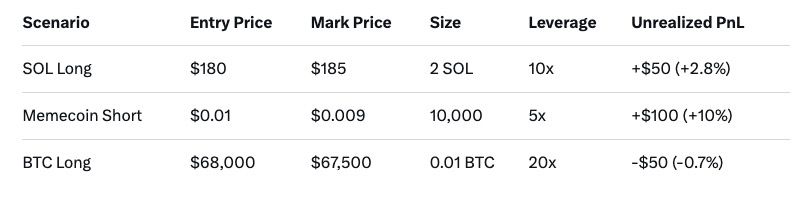
In "Trade History": Cumulative PnL (e.g., +$200 session total).
Interpretation: >5% unrealized? Consider partial close. Negative? Check fees eating gains.
Protect with liquidation metrics.
Liquidation happens when margin drops too low, closing your position at market price.
Formula: Liq. Price ≈ Entry ± (Margin / Size) / Leverage ( + for shorts).
Example: $500 margin, 10 SOL position at $200/SOL, 10x. Exposure $20,000. Liq. at ~$195 (5% drop).
Tooltip: "Add margin to boost ratio; auto-DCA available in settings."
2025 Feature: Ape.pro's "Risk Alerts" notify via Telegram at 120% ratio.
Avoidance Tip: Use stop-loss at 2x liq. price buffer.
Ape.pro's TradingView-integrated charts show candlesticks, volume, and indicators.
Example: 15m candle: Open $184.80, High $186.20, Low $184.50, Close $185.50 (bullish hammer).
Metrics Overlay: Hover for "24h High/Low: $190/$180 | ATH: $260".
Pro Use: Enable "Funding Rate" line (e.g., +0.01% hourly for longs—pays shorts).
Fees on Ape.pro are low, but they add up.
Other Metrics:
Example: $1,000 trade, taker: Fee = $0.70. Cumulative in "Fees" tab: -$2.50 week.
2025 Lowdown: Zero gas on L2 bridges; rebates for >$10k volume.
Data based on Nov 2025 averages; check in-app.
Integrate with tools: Export CSV for Excel PnL tracking.
While Ape.pro excels in Solana perps, for spot swaps across chains (e.g., ETH to SOL), Baltex.io offers zero-commission routes via 200+ networks. Connect wallet > Select pair > Preview <0.2% cost > Swap. Ideal post-Ape.pro for diversification.
(Unrealized) PnL = (Mark - Entry) x Size x Direction. E.g., $5 rise on 10 SOL long = +$50.
5-10x max; keeps liq. buffer >10%. Higher risks 50%+ drawdowns in volatility.
Volatility and funding adjust it; monitor ratio—aim >150%.
In preview popup: Breakdown of taker/maker + est. gas. Total <0.1% typical.
Total leveraged positions (e.g., $100M); high OI signals crowd—watch for reversals.
Yes—focus on candles (green up) and volume spikes. Add RSI for overbought (>70).
Reading numbers on Ape.pro isn't rocket science—it's about connecting prices to positions, leverage to risks, and PnL to profits. With Solana's speed and Ape.pro's tools, you're equipped to navigate memecoin frenzies or BTC dips without the fog.
Practice in demo, set alerts, and remember: Numbers tell stories—listen to liq. risks and fees first. For broader swaps, Baltex.io bridges the gaps. What's your biggest Ape.pro win? Share below.
G. Khan
G. Khan
G. Khan
G. Khan
G. Khan
G. Khan