In 2025, crypto moves faster than ever. Bitcoin regularly hits six figures, altcoins can 10x in weeks, and new trends appear every day. To survive and profit as a beginner, you need to read charts — without overcomplicating things.
This complete 2025 guide explains everything step-by-step with pictures, tables, and real examples you can use today.
Real traders spend 90% of their time reading charts — here’s what they actually look at.
Practice on demo accounts and start with 4H or daily timeframes.
A chart is simply the price history of a coin over time. Nothing more, nothing less.
Typical TradingView chart in 2025: candlesticks + volume bars at the bottom
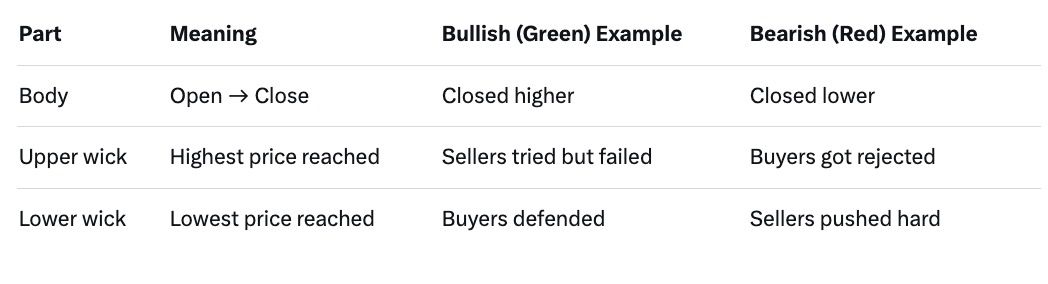
Each candle shows 4 prices in one time period:

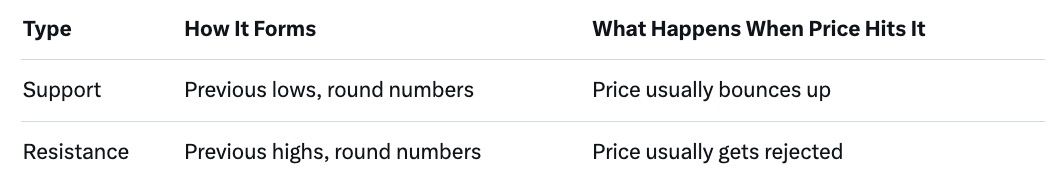
Pro tip in 2025: $100,000 Bitcoin and $10,000 Ethereum are massive psychological levels.
Real breakout checklist (use all 4):
When you spot a confirmed breakout and want to rotate into the winning coin fast, use baltex.io — instant cross-chain swaps with no KYC and some of the lowest fees in 2025.
January 2025 daily chart:
Q: Which timeframe should beginners use? A: Start with daily, then 4-hour once comfortable. Avoid anything below 1-hour.
Q: Do I need paid indicators? A: No. Candles + volume + horizontal lines are enough for the first 6–12 months.
Q: Are patterns the same on every coin? A: Yes — Bitcoin, Ethereum, meme coins, everything follows the same rules.
Q: How much should I risk per trade? A: Never more than 1–2% of your total portfolio.
Q: Where can I swap coins instantly after spotting a setup? A: baltex.io — no registration, cross-chain, fixed-rate or floating, works perfectly in 2025.
Charts are the only thing that never lie in crypto. Price already includes every news, tweet, and whale move. Learn to read candlesticks, draw clean support/resistance, and respect volume — and you’ll be ahead of 95% of beginners in 2025.
Start small, practice every day, keep a trading journal, and never risk money you can’t afford to lose.
See you at the charts — and maybe on baltex.io when the next big move hits.

G. Khan

G. Khan

G. Khan

G. Khan

G. Khan

G. Khan