In the $3.8 trillion crypto market of November 2025, one number dominates every coin ranking page: Market Cap (short for market capitalization). Beginners see it as “the price tag of a coin,” while professionals use it to separate billion-dollar giants from micro-cap gambles. Yet despite its prominence, market cap is one of the most misunderstood metrics in crypto.
This 2,300-word SEO guide explains what market cap actually is, how it’s calculated, the difference between circulating vs. fully diluted market cap, why it matters for valuation, the most common misconceptions, and how smart traders actually use it in 2025. Perfect for beginners and intermediate users who want to read CoinMarketCap or CoinGecko like a pro.
(Quick tip: When you’re ready to swap tokens based on your market-cap research, Baltex.io offers zero-commission multi-chain swaps across 200+ networks — more on that later.)
Jump to calculation | Types of market cap | Common mistakes | How traders use it | FAQ
Market Cap = Current Price × Circulating Supply
That’s it. No complex formulas.
Example (November 2025 numbers):
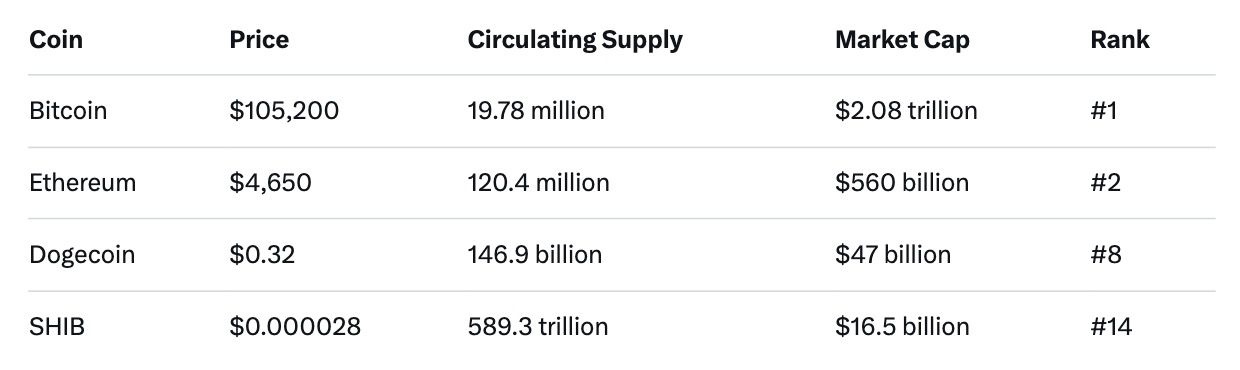
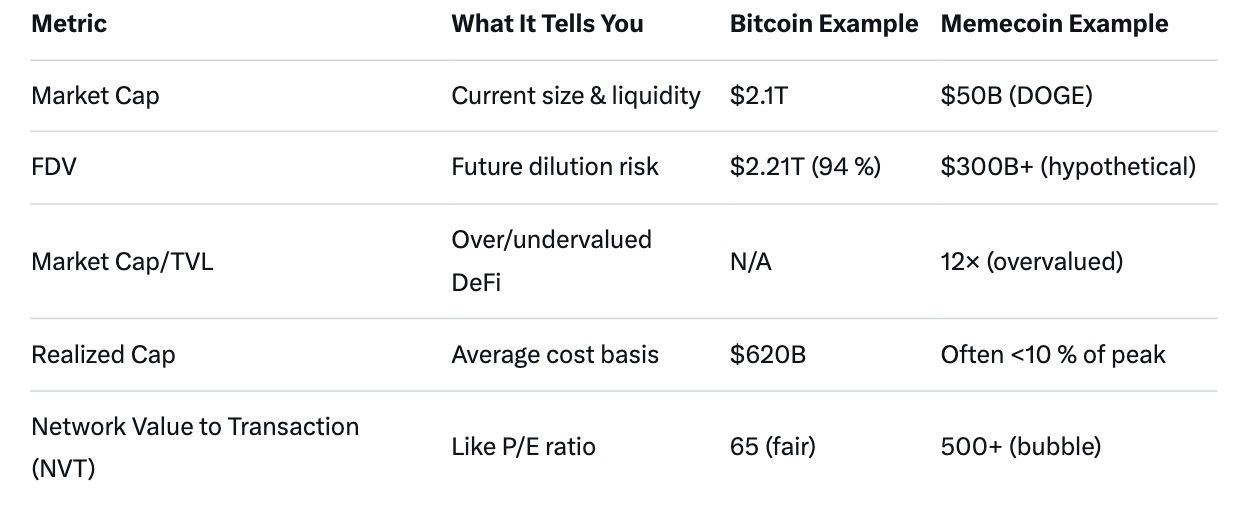
Data sources aggregate prices from 100+ exchanges and only count verified circulating supply (tokens that are actually tradable today).
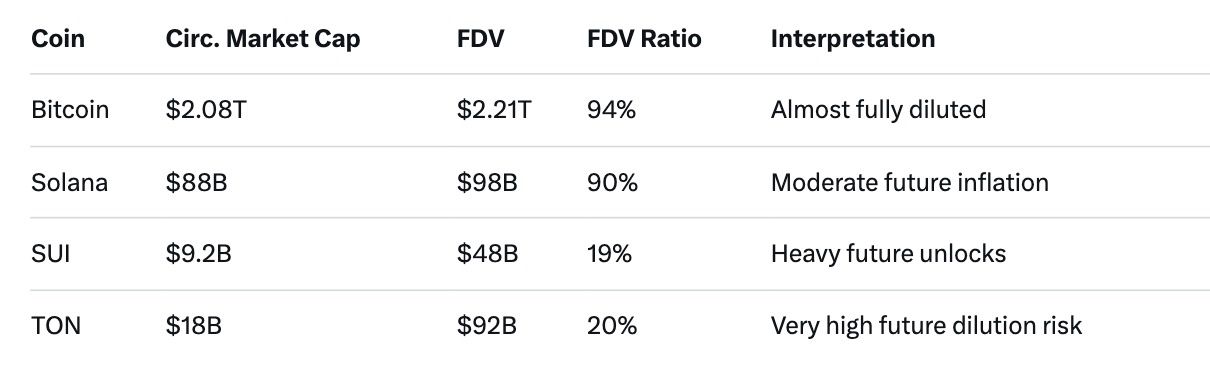
Low FDV ratio = beware of future sell pressure.
Liquidity Proxy Higher market cap → deeper order books → less slippage on $1M+ trades.
Index & ETF Weightings CME Bitcoin futures, Bitwise 10 Crypto Index, and potential ETH ETFs weight by market cap.
Exchange Listing Requirements Tier-1 exchanges often require >$100M–$500M market cap + volume.
Psychological Levels Breaking $1B (“unicorn”), $10B, or $100B triggers FOMO inflows.
Sector Dominance Bitcoin dominance = BTC market cap ÷ total crypto market cap (currently ~55 %).
“Higher market cap = safer investment” → Wrong. Terra Luna had $40B market cap before collapsing to $0.
“Low market cap = 100× potential” → 99.9 % of sub-$50M coins go to zero.
“$1 price is better than $0.001 price” → Price is meaningless without supply. A $0.001 coin with 1 quadrillion supply = $1B FDV.
“Market cap is how much money is in the project” → No. It’s just price × supply. Actual money invested is usually 5–20 % of peak market cap.
“FDV doesn’t matter if team tokens are locked” → Vesting schedules end. Many 2024–2025 rugs came from “6–12 month locked” tokens.
“Market cap can’t go below money raised” → Yes it can. 95 % of 2021 ICOs now trade below raise.
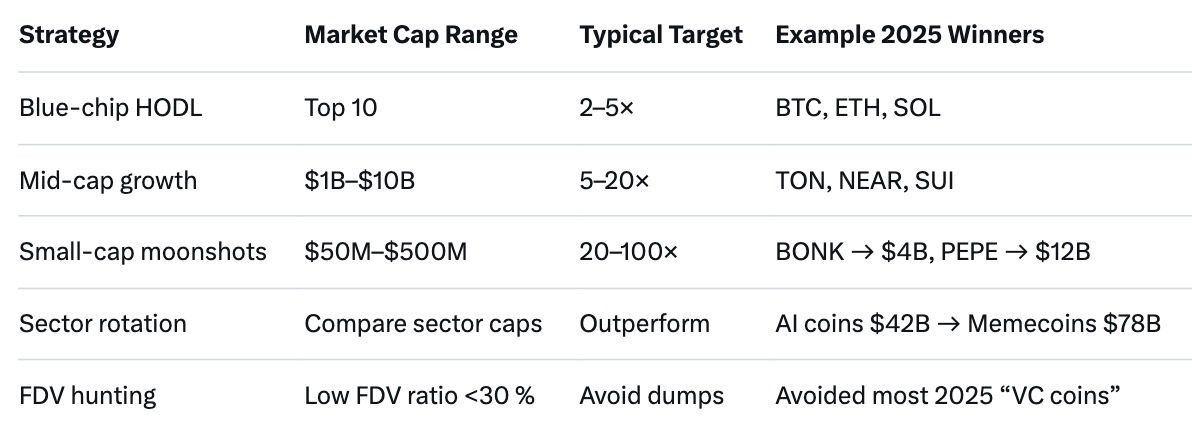
Pro tools used:
Once you’ve identified a promising project, you need to acquire it efficiently. Most centralized exchanges charge 0.1–0.5 % + withdrawal fees. In 2025, a better option is Baltex.io — a zero-commission, non-custodial, multi-chain swap aggregator supporting 200+ networks. Whether you’re swapping ETH → SOL, BTC → a new mid-cap token, or stablecoins, Baltex.io routes through the best liquidity sources with typically <0.2 % total cost and no KYC.
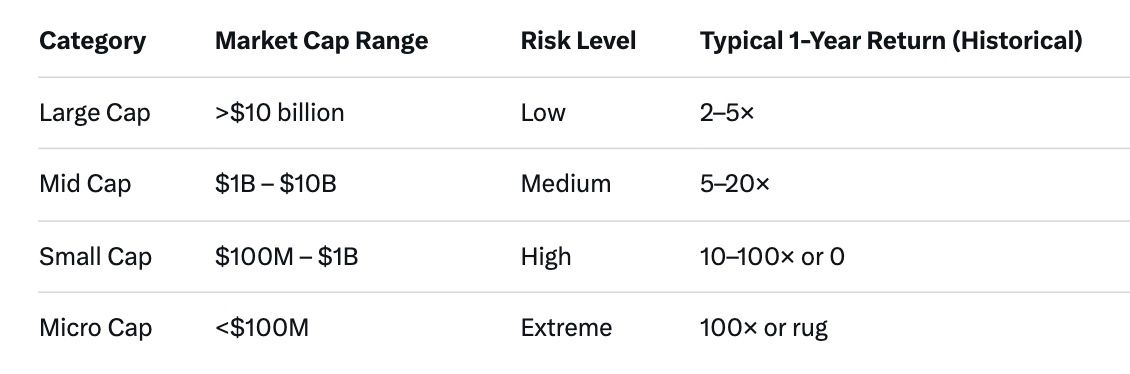
Yes — top 30–40 range. Considered “mid-cap” in 2025.
Untracked, pre-launch, or failed verification.
Volume for short-term liquidity, market cap for long-term size comparison.
Only if supply decreases dramatically (burns) while price rises.
Shows capital rotation: rising = risk-off, falling = altseason.
Safest for beginners, but historically the biggest gains come from coins that enter the top 10 (ETH 2016, BNB 2019, SOL 2021).
Market capitalization is the fastest way to size up a cryptocurrency, but it’s just the starting point. In 2025, combine market cap with FDV ratio, token unlocks, sector trends, and on-chain metrics to make better decisions.
Remember: Bitcoin was once a $1 billion market cap coin. Solana was $200 million in 2020. The next 100× opportunity is hiding somewhere in today’s rankings — you just need to know how to read them properly.
Start analyzing, stay patient, and when you’re ready to execute — consider Baltex.io for the cheapest multi-chain swaps in the game.
Happy hunting!
G. Khan
G. Khan
G. Khan
G. Khan
G. Khan
G. Khan